Thư viện Python’s Sklearn cung cấp một trình tạo tập dữ liệu mẫu tuyệt vời sẽ giúp bạn tạo tập dữ liệu tùy chỉnh của riêng mình. Nó nhanh chóng và rất dễ sử dụng. Sau đây là các loại mẫu mà nó cung cấp.
Đối với tất cả các phương pháp trên, bạn cần nhập sklearn.datasets.samples_generator.
# importing libraries
from sklearn.datasets.samples_generator

# matplotlib for ploting
from matplotlib import pyplot as plt
from matplotlib import style
Nội dung chính
sklearn.datasets.make_blobs
# -----------------------------------------------------------
#Cafedev.vn - Kênh thông tin IT hàng đầu Việt Nam
#@author cafedevn
#Contact: cafedevn@gmail.com
#Fanpage: https://www.facebook.com/cafedevn
#Group: https://www.facebook.com/groups/cafedev.vn/
#Instagram: https://instagram.com/cafedevn
#Twitter: https://twitter.com/CafedeVn
#Linkedin: https://www.linkedin.com/in/cafe-dev-407054199/
#Pinterest: https://www.pinterest.com/cafedevvn/
#YouTube: https://www.youtube.com/channel/UCE7zpY_SlHGEgo67pHxqIoA/
# -----------------------------------------------------------

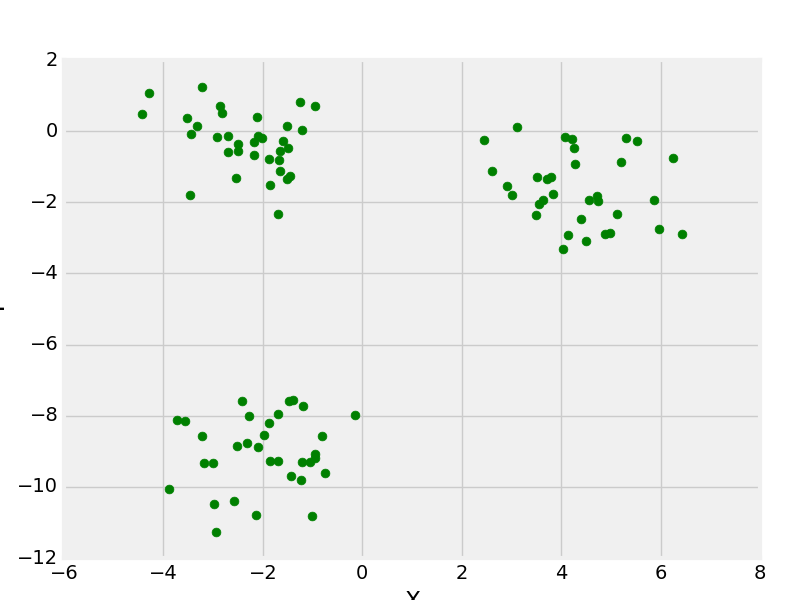
# Creating Test DataSets using sklearn.datasets.make_blobs
from sklearn.datasets.samples_generator import make_blobs
from matplotlib import pyplot as plt
from matplotlib import style

style.use("fivethirtyeight")

X, y = make_blobs(n_samples = 100, centers = 3,
               cluster_std = 1, n_features = 2)

plt.scatter(X[:, 0], X[:, 1], s = 40, color = 'g')
plt.xlabel("X")
plt.ylabel("Y")

plt.show()
plt.clf()
Output:

sklearn.datasets.make_moon
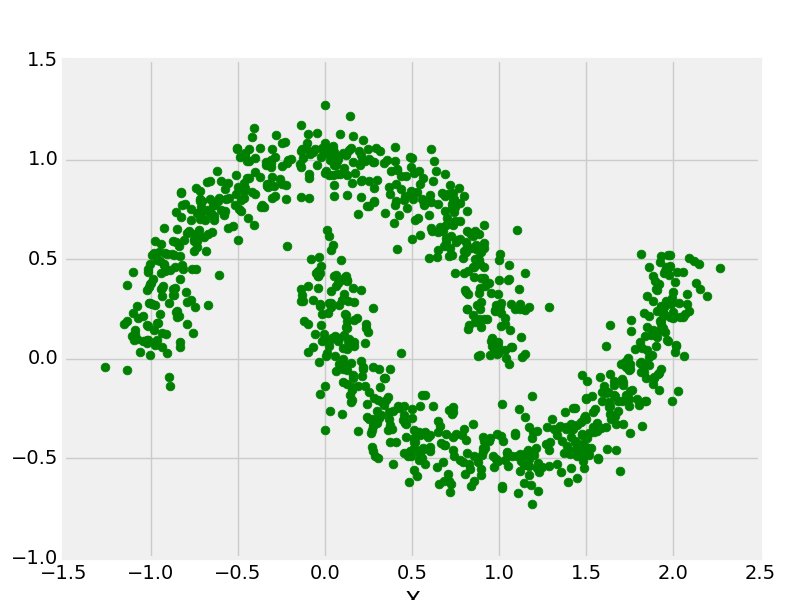
# Creating Test DataSets using sklearn.datasets.make_moon
from sklearn.datasets.samples_generator import make_moon
from matplotlib import pyplot as plt
from matplotlib import style

X, y = make_moons(n_samples = 1000, noise = 0.1)
plt.scatter(X[:, 0], X[:, 1], s = 40, color ='g')
plt.xlabel("X")
plt.ylabel("Y")

plt.show()
plt.clf()
Output:

sklearn.datasets.make_circle
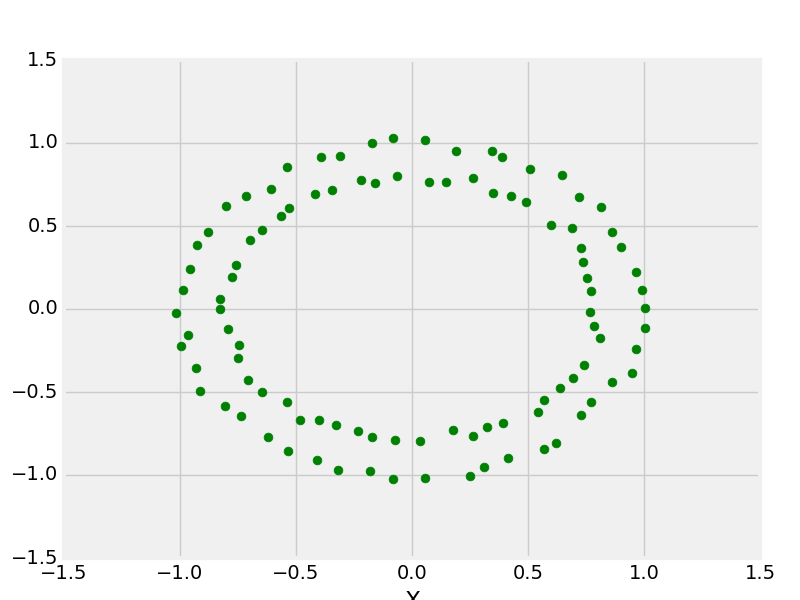
# Creating Test DataSets using sklearn.datasets.make_circles
from sklearn.datasets.samples_generator import make_circles
from matplotlib import pyplot as plt
from matplotlib import style

style.use("fivethirtyeight")

X, y = make_circles(n_samples = 100, noise = 0.02)
plt.scatter(X[:, 0], X[:, 1], s = 40, color ='g')
plt.xlabel("X")
plt.ylabel("Y")

plt.show()
plt.clf()
Output:

Cài ứng dụng cafedev để dễ dàng cập nhật tin và học lập trình mọi lúc mọi nơi tại đây.
Nguồn và Tài liệu tiếng anh tham khảo:
Tài liệu từ cafedev:
- Full series tự học Python từ cơ bản tới nâng cao tại đây nha.
- Tự học ML bằng Python từ cơ bản tới nâng cao.
- Ebook về python tại đây.
- Các series tự học lập trình MIỄN PHÍ khác
- Nơi liên hệ hợp tác hoặc quảng cáo cùng Cafedevn tại đây.
Nếu bạn thấy hay và hữu ích, bạn có thể tham gia các kênh sau của cafedev để nhận được nhiều hơn nữa:
Chào thân ái và quyết thắng!


![[Tự học C++] Số dấu phẩy động(float, double,…) trong C++](https://cafedev.vn/wp-content/uploads/2019/12/cafedevn_c_develoment-100x70.jpg)

